
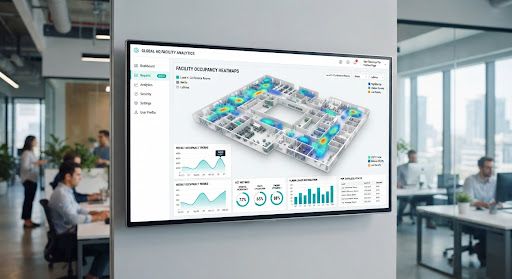
From data overload to data clarity
Every day, a facility management platform generates thousands of data points: service requests submitted and resolved, payments collected and outstanding, meter readings taken, visitors checked in and out, equipment serviced and decommissioned. Without analytics, this data is noise — a pile of records that nobody has time to review. With analytics, it becomes insight.
Dashboards that answer real questions
Haag analytics is built around the questions facility managers actually ask:
Operational health
- How many service requests were submitted this month vs last month?
- What is the average resolution time, and is it improving or worsening?
- Which service providers have the best (and worst) response times?
- Are there recurring issues in specific units or buildings?
Financial performance
- What is the collection rate for this billing cycle?
- How much is outstanding, and how much is overdue?
- What are the top expense categories, and are they trending up or down?
- How does this property compare to other properties in the portfolio?
Asset and maintenance
- Which assets have the highest maintenance cost relative to their value?
- Are we spending more on reactive repairs or preventive maintenance?
- Which assets are approaching end-of-life and need replacement budgeting?
From reporting to predicting
Most analytics tools stop at reporting — showing you what happened. Haag goes further with predictive insights:
- Anomaly alerts — the system flags unusual patterns automatically. A spike in water consumption in a specific unit. A drop in collection rate for a specific building. A service provider whose response time is degrading month over month.
- Trend forecasting — by analysing historical data, the system can project future costs, collection rates, and maintenance needs. This helps managers set budgets that reflect reality, not last year's numbers.
- Benchmarking — for portfolio managers, the system benchmarks properties against each other. Which building has the highest collection rate? Which has the most service requests per unit? These comparisons surface best practices and problem areas that would otherwise stay hidden.
Custom reports for stakeholders
Different stakeholders need different data. Residents want to see their own payment history and service request status. Facility managers want operational dashboards. Property owners want financial summaries. The analytics engine generates role-based reports automatically — and supports custom report builder for ad-hoc queries.
The bottom line
Facility management is a data business. The properties that leverage their data will outperform those that do not — in resident satisfaction, in operational efficiency, and in financial returns.
Every dashboard in Haag is designed to drive a decision, not just display a number. That is the difference between analytics and reporting — and it is the difference between a facility that is managed and one that is merely maintained.


